Logs and Troubleshooting
View webhook logs and retry or delete webhook activities on queue
This article applies to: Standard Webhooks, Legacy Webhooks, and Custom HTTP
Remember that there are three sources of webhook and http events as mentioned above. All events triggered from any of these sources goes to queue, and can be seen on a common log page. There are two pages for these logs:
- Webhook Engine - displays event logs in groups and allows you to retry or delete the same events in bulk
- Webhook Logs - displays event logs individually and allows you to view more details of each event
Webhook Engine
To access the webhook engine:
- Log in to your enterprise web portal (e.g., example.zyllem.com)
- Go to Settings > Engine and then Webhooks tab. To see the individual events on queue, click on the group key. From here, you can identify the webhook events and the specifics of the events that failed.
To identify standard webhooks from legacy webhooks, look into the Group Description. All legacy webhooks will indicate 'event management'. In the example below, the first three logs are legacy webhooks(i.e., 'Failed delivery', 'Returned', and 'Full Delivery'), and the last log is a standard webhook.

Event Count is the number of unique events in that group. Fail Count is the number of times the events failed.
Retrying Events
To retrigger all events in the group, click Wake Up.
The Wake Up function retries the processing of the event. The system will keep on retrying in the following pattern:
| Retry (Wakeup) | Frequency and behavior |
|---|---|
| 1 | Retry every 0 seconds |
| 2 | Retry every 0.5 seconds |
| 3 | Retry every 10 seconds |
| 4 | Retry every minute within the first 24 hours |
| 5 | Retry every every hour after the first 24 hours, |
| 6 | Discard the event after 48 hours |
Clearing webhook events stuck on queue
If a certain event fails, all succeeding events in that group will be stuck in the queue. To delete all events in the group, click Delete Events. To retry the event, click Retry.
Webhook Logs
To access the Webhook logs:
- Log in to your enterprise web portal (e.g., example.zyllem.com)
- Go to Settings > Logs.
- Click on Webhook tab.
Here you can search for the Shift ID, Activity ID, and other properties. See list of searchable properties.
The system only displays webhook logs from the last 30 days.
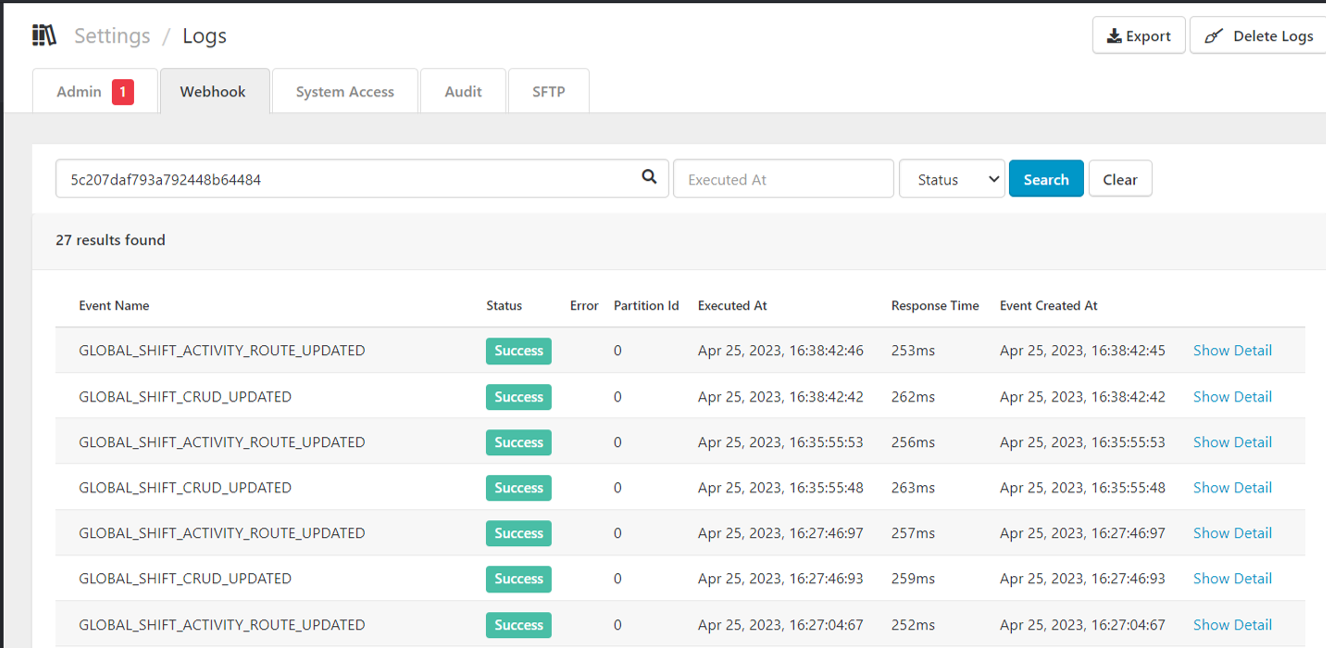
To view the details of the failed event, click Show Detail.
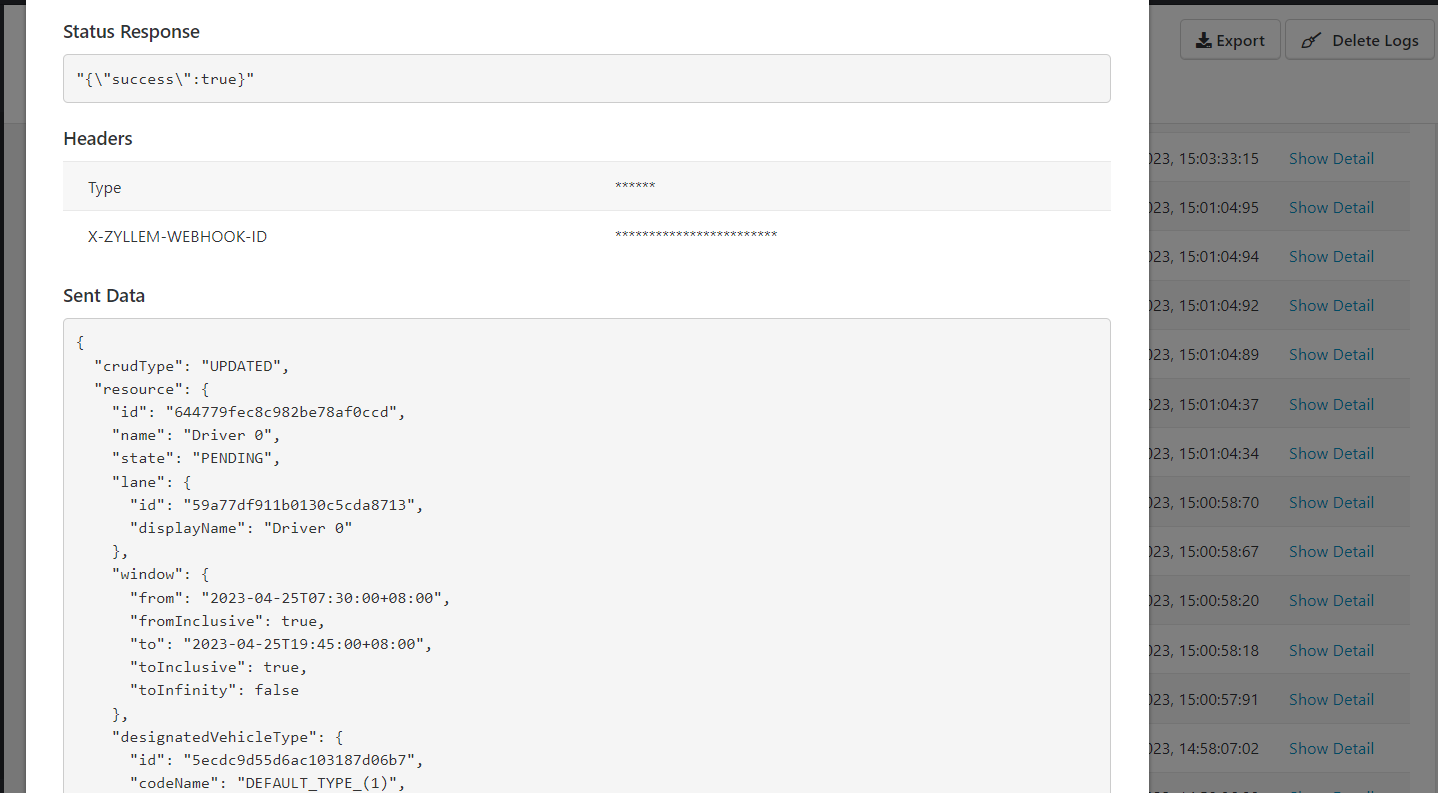
- Event Created At - When the webhook was created
- Response Time - Client's processing duration; how long it took for the client to process the webhook
Searchable Properties
Below are the searchable properties in the Webhook Logs page:
Custom events webhooks
- itemId
- Item customProperties value of type ID, Text, Numeric & Option value (Money cannot be searched)
- Events module’s “Name of Notification”
- Events action id
- Events id
- Events module Event Type’s Name
- Events module Event Type’s Event key
Global webhooks
- Webhook event’s Webhook key
- Webhook event’s Key
- itemId
- Item customProperties value of type ID, Text, Numeric & Option value (Money cannot be searched)
- shiftId
- resourceId
- scheduleId
- activity/ activities id
- laneId
- userId
- vehicleId
- teamId
- operatorId
Updated about 1 year ago